Overview
可视化 数据地图
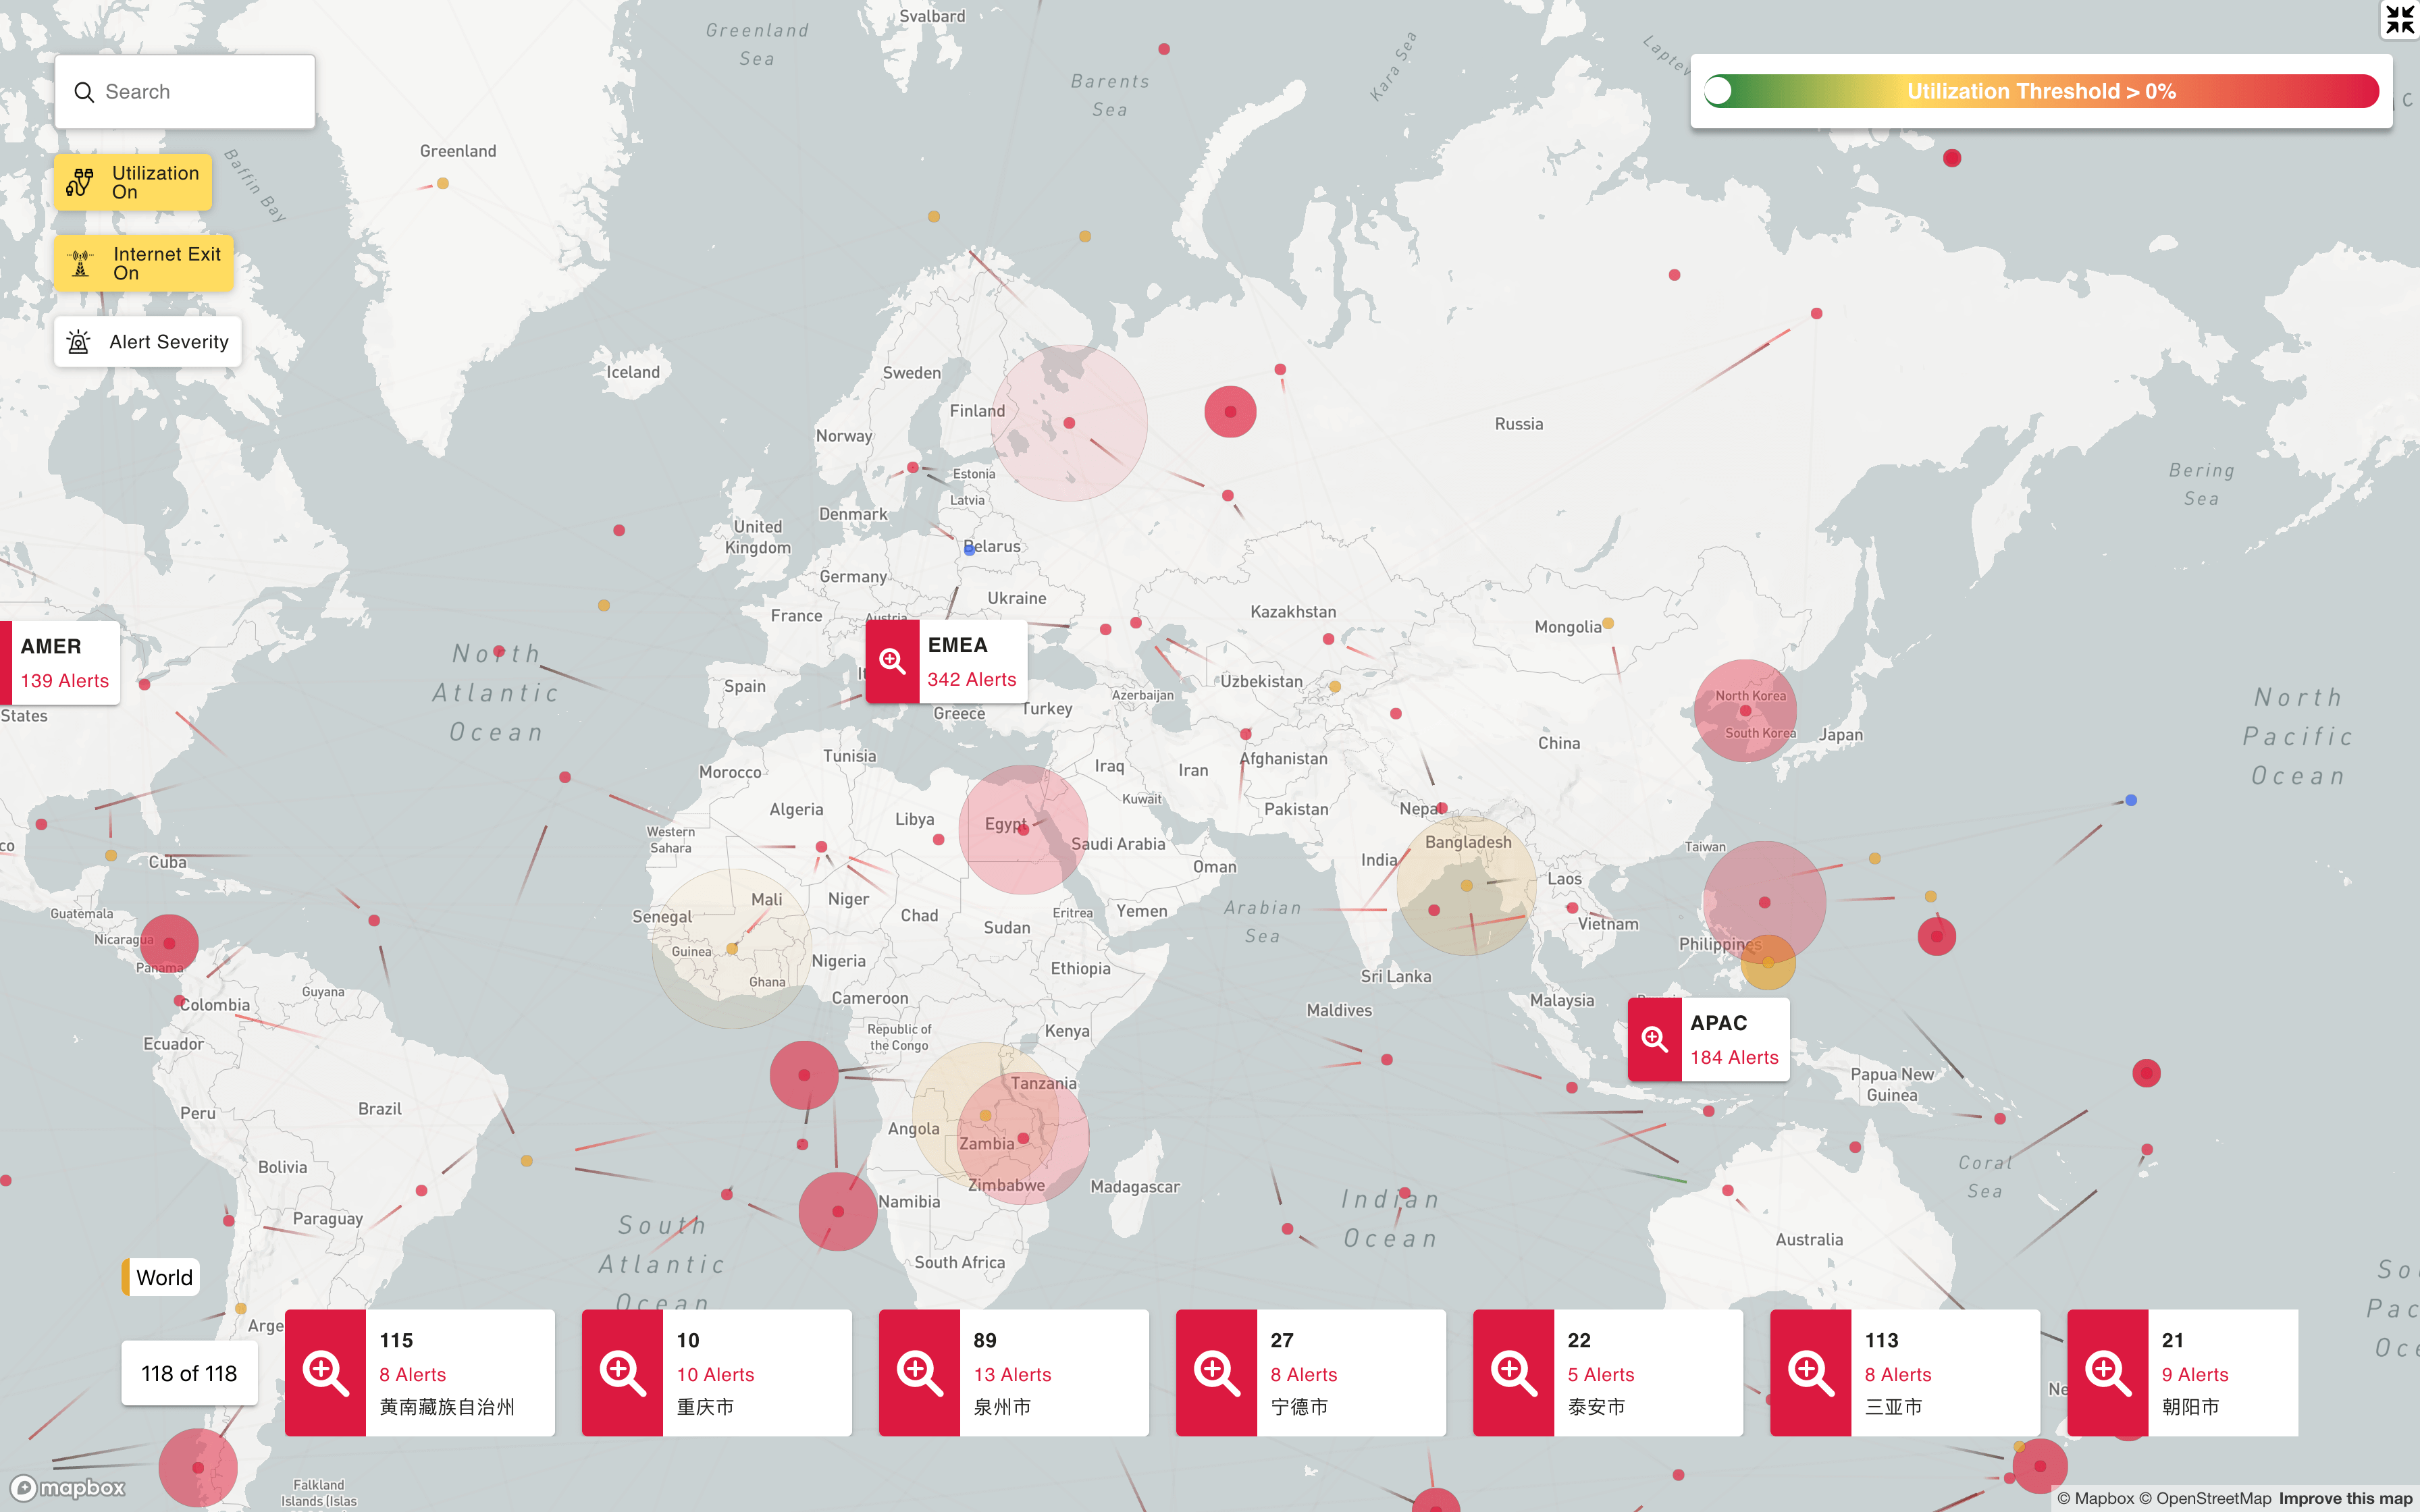
实时更新全球 office 网络状态,设备负载,流量状态
Demo
技术栈
Reactreact-router-domNode Koa2Middleware 中间层,业务层处理整合前后端数据格式差异@testing-library/react单元测试deck.gl & react-map-glWebGL freameworkmaterial-uiUI 库lesscss 预处理eslintairbnb 标准axiospromis 库 前后端对接mockJs超前 api,拦截 Ajax 请求 生成随机数据
Mark
动画图层
import DeckGL, {GeoJsonLayer, TripsLayer, TextLayer} from 'deck.gl'
- GeoJsonLayer 用于渲染节点,这里用两个实例,上下叠加,
- 下层实例定位
- 上层实例的 radius 及 opacity 随 Date.now()循环渐扩动画
- TextLayer 位于最下层,视角拉近节点时,显示节点相关 info
- TripsLayer 位于最上层,这里同样用两个实例,上下叠加,
- 下层极小 opacity 显示整个 两个节点之间路径,用于鼠标 hover 上去显示路径相关 info
- 上层在下层基础上展示一段路径的运动轨迹,随 Date.now()循环从起点移动到终点
state 交互控制
const { currentSetting, setShowPopup, setPopupInfo, setShowPopupLine, setPopupInfoLine, setShowDrawer, setDrawerInfo, watchLocation, initialViewState } = props
位于 canvas 上层的是 HTML DOM,用户可以控以下多种筛选规则
- 根据 input 搜索节点 name,对应于 canvas 中,只展示匹配结果中的节点 及 匹配结果内相关流量路径
- switch 显示隐藏流量路径图
- switch 显示隐藏 GeoJsonLayer 上层实例 扩放动画
- 4 个 checkbox 按告警类型筛选节点,及匹配的节点相关流量,基于 input 搜索基础上。
- 右上角 color ranger 根据流量路径的负载 percent,控制显示的流量路径
- 左下角 world / region 根据 region 快速定位到相关节点,基于 input 搜索基础上。
- 界面下层 节点列,click 后 地图缩放居中定位到 canvas 内节点位置,同时打开 Drawer 展示该节点详细告警内容
- 鼠标 hover 到 canvas 内节点时,隐藏与本节点无关的路径,定位到 dom 中位置,展示相关 popup
- 鼠标 click 到 canvas 内节点 效果同 click DOM 节点列
所有交互规则存在currentSetting,
基于 useMemo(_, [ locationData, alertData, connectionData, currentSetting ]) 触发重新渲染canvas
数据整合
const { location, alert, connection } = remoteResponse
- location define 节点横纵坐标,id,region 等相关信息
- alert define 所有告警相关信息,包括节点 id,告警时间内容类型等
- connection define 所有数据流通相关信息,包括始终节点 id,流量,负载 percent 等
数据整合目标:
- 统计每个节点的告警总数量,其中各个告警类型的数量
- 节点需要列在界面底部,按告警类型和相应告警数量排序,节点颜色 基于 已有类型的 priority
- 统计每个流量路径的始终节点,及流量负载,路径颜色 基于 负载 percent
- 展示给图层的流量数据 基于 界面右上角的 color ranger,对应于路径的负载 percent
function formatLayerData(locations, alerts, connections, currentSetting) {
  const showAlertTypes = [];
  for (let key in currentSetting) {
    if (key in showKeyMap && currentSetting[key])
      showAlertTypes.push(showKeyMap[key]);
  }
  let pointsData = locations
    .filter((item) => item.network_code.includes(currentSetting.codeFilter))
    .map((item) => {
      let alertMsgMap = {
        critical: [],
        minor: [],
        warning: [],
        normal: [],
      };
      alerts
        .filter((it) => locationMapping[it.location] === item.network_code)
        .forEach((it) => {
          alertMsgMap[it.severity.toLowerCase()].push({
            message: it.message,
            host_name: it.host_name,
          });
        });

      const alert = alertMsgMap.critical.length
        ? showKeyMap.critical
        : alertMsgMap.minor.length
        ? showKeyMap.minor
        : alertMsgMap.warning.length
        ? showKeyMap.warning
        : showKeyMap.normal;
      const geometry = {
        type: "Point",
        coordinates: [Number(item.longitude), Number(item.latitude)],
      };
      return {
        ...item,
        ...alertMsgMap,
        alert,
        is_internet_exit: item.tag_ids.includes(1),
        geometry,
      };
    })
    .filter((item) => showAlertTypes.includes(item.alert))
    .sort((first, second) => {
      if (first.critical.length < second.critical.length) return -1;
      else if (first.critical.length === second.critical.length) {
        if (first.minor.length < second.minor.length) return -1;
        else if (first.minor.length === second.minor.length) {
          if (first.warning.length < second.warning.length) return -1;
          else return 1;
        }
      }
      return 0;
    });

  const locationObjs = {};
  pointsData.forEach((item) => (locationObjs[item.network_code] = item));

  const arcsData = connections
    .filter(
      (item) => item.bandwidth_usage >= currentSetting.minUtilization / 100
    )
    .filter(
      (item) =>
        item.network_conn.length === 2 &&
        locationObjs.hasOwnProperty(item.network_conn[0]) &&
        locationObjs.hasOwnProperty(item.network_conn[1])
    )
    .map((item) => {
      const locationPair = [
        locationObjs[item.network_conn[0]],
        locationObjs[item.network_conn[1]],
      ];
      if (!locationPair[1] || !locationPair[1].hasOwnProperty("city")) {
        console.log(locationPair[1]);
      }
      return {
        ...item,
        sourceOffice: item.network_conn[0],
        targetOffice: item.network_conn[1],
        sourceCity: locationPair[0].city,
        targetCity: locationPair[1].city,
        sourceCoordinate: [
          parseFloat(locationPair[0].longitude),
          parseFloat(locationPair[0].latitude),
        ],
        targetCoordinate: [
          parseFloat(locationPair[1].longitude),
          parseFloat(locationPair[1].latitude),
        ],
      };
    });
  return { pointsData, arcsData };
}